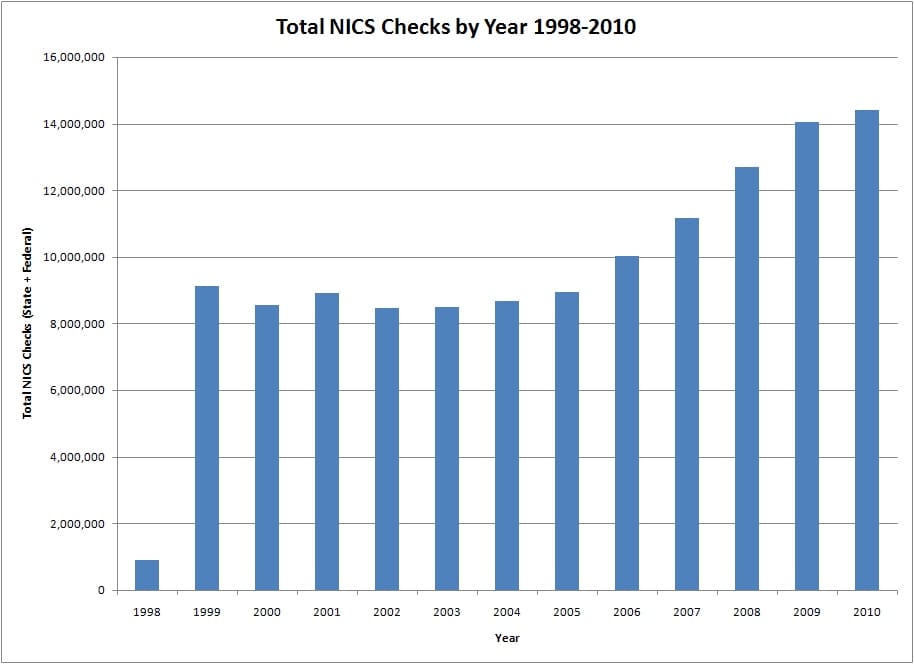
I was poking around the FBI’s website the other day and ran into a 2010 report about NICS (the National Instant Criminal Background Check System) checks, which is the background check that happens when you buy a gun from a gun shop and causes those 10 frustrating minutes after you’ve plunked down your dollars but before you can have the gun. Turns out they’ve done that exact same thing over 124 million times (124,427,448 as of December 31, 2010 to be exact) and have some interesting statistics to share.
One of the more interesting statistics the FBI shares right off the bat are the top five days and weeks in terms of volume of checks. Here’s the top five days (2011 excluded):
| Friday, November 28, 2008 | 97,848 |
| Saturday, October 02, 2010 | 89,593 |
| Friday, November 26, 2010 | 87,061 |
| Sunday, October 03, 2010 | 85,478 |
| Friday, November 27, 2009 | 83,660 |
| Friday, October 01, 2010 | 80,311 |
| Thursday, December 23, 2010 | 79,440 |
| Friday, December 22, 2006 | 75,132 |
| Saturday, December 23, 2000 | 74,891 |
| Tuesday, December 23, 2008 | 73,427 |
A couple things immediately stand out from this table. First is the day that keeps popping up: Black Friday. The number 1 day for NICS checks (and #3, and #5…) is the day after Thanksgiving, the national holiday celebrating American capitalism. Conspicuously absent from the “top” days and even weeks tables are the days following Election Day 2008, when Barack Obama was elected. Another anomaly of note is that three consecutive days, October 1st through 3rd, 2010, all appear in the top 10 days but I can’t figure out why. Tim, on the other hand, has a pretty good theory:
As for October 2008 – Reading through this might give you some idea of why – the housing markets, uncertainty and the odds for Obama winning increasing after McCain suspended his campaign… http://en.wikipedia.org/wiki/October_2008
Of the 124+ million NICS checks that dealers have done over the years just under 821,000 have been denied. That means every time someone buys a gun there’s a 0.6% chance they’ll be denied. Don’t fall for the ludic fallacy on that one, I just thought it was a nifty statistic. Thankfully, the FBI has broken out their denials into another easy to understand table.
| Convicted of a crime punishable by more than one year or a misdemeanor punishable by more than two years | 507,495 | 61.82% |
| Misdemeanor Crime of Domestic Violence Conviction | 90,958 | 11.08% |
| Unlawful User or Addicted to a Controlled Substance | 64,626 | 7.87% |
| Fugitive From Justice | 62,955 | 7.67% |
| Protection/Restraining Order for Domestic Violence | 35,972 | 4.38% |
| State Prohibitor | 27,048 | 3.30% |
| Illegal/Unlawful Alien | 10,252 | 1.25% |
| Under Indictment/Information | 9,791 | 1.19% |
| Adjudicated Mental Health | 6,103 | 0.74% |
| Federally Denied Persons File | 5,097 | 0.62% |
| Dishonorable Discharge | 547 | 0.07% |
| Renounced U.S. Citizenship | 4 | 0.01% |
From the statistics it seems like the majority of the denials come from convicted criminals and perpetrators of domestic violence. Among the people who probably shouldn’t own firearms those categories would rank the highest in my book, so that’s good.
In order to make the NICS system truly instant the FBI uses a computerized database of names and identifying features of “bad guys.” When your dealer calls the NICS operators, they check the information you gave the dealer against that database. If there’s a match they send it off to an investigator for further digital detective work, but if there’s no match then they give the dealer the green light. So what kinds of records are in this database?
| Illegal/Unlawful Alien | 4,413,223 | 68.50% |
| Adjudicated Mental Health | 1,107,758 | 17.20% |
| Convicted of a crime punishable by more than one year or a misdemeanor punishable by more than two years | 435,022 | 6.75% |
| Fugitive From Justice | 367,110 | 5.70% |
| Misdemeanor Crime of Domestic Violence Conviction | 54,559 | 0.85% |
| Federally Denied Persons File | 35,993 | 0.56% |
| Renounced U.S. Citizenship | 15,346 | 0.24% |
| Dishonorable Discharge | 9,881 | 0.15% |
| Unlawful User/Addicted to a Controlled Substance | 2,092 | 0.03% |
| Protection/Restraining Order for Domestic Violence | 1,357 | 0.02% |
| Under Indictment/Information | 197 | 0.00% |
Interesting. 61% of the NICS denials come from only 6.75% of the records, with 68.5% of the records pertaining to illegal immigrants (who account for a little over 1% of denials).
One last thing. Remember that article the other day about how the firearms industry is dying?
Yeah, not so much.
Interesting stuff this statistics…


All those statistics and I got hung up on 10 mins waiting – try ten days for those of us in PRK.
Election Day for Obama was 2008, not 09 – Inauguration day is Jan 20, 2009. As for October 2008 – Reading through this might give you some idea of why – the housing markets, uncertainty and the odds for Obama winning increasing after McCain suspended his campaign… http://en.wikipedia.org/wiki/October_2008
Now I await the anti gun statistician to explain to me how this is actually the death of firearms through excessively fast growth. My B of S was only through a state school, not Harvard so I probably just don’t get maths.
Wow. Re the graph, I would have expect to see spikes after Obama’s election and 9/11… but what happened in 1999? Or is that just when they started using the system on a large scale?
The system came online on November 30, 1998.
How many of the 821,000 denials were in error? How many times was Joe A. Smith denied a gun due to a violation from Joe B. Smith? Or from Jose “Smith” with a stolen social security number?
Also, of those 821,000 denials, how many were followed up on and resulted in conviction for illegally trying to purchase a firearm?
No information on convictions, but…
“Also, of those 821,000 denials, how many were followed up on and resulted in conviction for illegally trying to purchase a firearm?”
Very good question and one I’d like to know the answer to as well. If the law is on the books, why is the government not going after these guys? It makes it all seem like security theater.
And you expected more?
Ask the Brady campaign. After all, this would be common sense gun control.
With this information, how is it, that many pro-gun sites have lowered the number of American gun ownership and the amount of guns in the United States? Around five years ago it was 90 million gun owners and 250 million guns, now some very influential pro gun sites (like Keep And Bear Arms) have it down to 80 million gun owners and still at the 250 million guns. What’s up with the discrepancy?
See my comment below – the polling data consists of “gun owners who are stupid enough to tell some stranger on the phone that they have guns in the house.” Most polls have a hang-up rate of 80-90%, which drastically lowers their validity, and most polls don’t even try to contact people without land-line phones.
Would anyone on this site tell some phone pollster that they have guns? Or even talk to them for more than 5 seconds?
While I agree with your explanation, I can not understand why pro gun sites would help perpetuate the misinformation spewed by the anti’s!
Maybe so the anti’s will continue to underestimate the numbers of gun owners? I would just as soon have the Brady bunch continue to live in fantasyland.
So – 124 million background checks on purchases of guns since Nov. 1998, with major yearly increases (10-15%) every year since 2006. That’s a whole lotta’ gun buying by what the media calls “an ever-decreasing number of households owning guns” (based on polling of the gun-owner subset described as “gun owners who are stupid enough to tell some stranger on the phone that they own guns”.)
At the same time, we have seen statistically significant DECREASES in violent crime in America, running about 3-6% lower every year, with a 12% decrease in violent crime in 2010. Liberal politicians and anti-gun pundits are at a loss to explain this reduction in crime during hard economic times.
Criminals, on the other hand, could probably explain it quite easily: “Ain’t no percentage in taking on some old fart or woman who might be carrying a gun.” Of course, these unsophisticated criminals lack the advantage of a Harvard degree, so they cannot be expected to understand the delicate nuances of how evil it is for potential victims to arm themselves against crime.
Let’s see, 124 million new gun purchases, reduced violent crime, hmmmm – maybe it can be explained by the crime data collected by John Lott in every county in the lower 48 states, where he found a 4-6% reduction in violent crime in every state that passed “shall-issue” concealed firearms permit laws. (See his book, “More Guns, Less Crime”.)
I stand corrected – violent crime was only 6.5% lower in 2010, according to the FBI report featured below.
Some of those NICS checks were transfers. I sold three guns that went through the NICS during this period so that contributes to the numbers, new owners not necessarily new guns. But the gun business is indeed booming. Prices are going up in response to demand.
Interesting. Was 1998 a full year? The jump from 1998 to 1999 was incredible. 1999 was the year the artificial Bill Clinton economic bubble burst. It is also interesting that the checks actually dipped after 2001 (9/11/2001 year) for a few years. It doesn’t appear that gun checks really started climbing quickly (beyond average) until 2006.
Also note that these numbers are NICS checks, not firearms purchased.
Exactly. One NCIS check can purchase a truckload of rifles.
Or if you are a felon buying guns under the ATF/FBI approved Fast & Furious, one check can buy 700 AK-47s!
yeah except domestic violence as a reason to deny a firearm is stupid. Apparently you can grab a stranger and still own a gun but grab a woman who keeps coming back for more and you’re too dangerous.
Comments are closed.