 Just as I was tucking into my dessert, my phone started vibrating. It was RF, our fearless leader, asking me to do something for him. He wanted me to give the site’s statistics a once-over and try to glean some information from them, something we can learn to tailor the content to what the readers want. What did I find? Make the jump and I’ll let you in on our secrets…
Let’s start with some summary statistics. Since January 1 2011 we have had 971,962 visitors who, combined, viewed 1,819,809 pages on the site. That’s one point eight MILLION views in four months. Those visitors spent on average two minutes and thirty-five seconds reading articles before jumping off to whatever corner of the internet they came from. That means we’ve collectively wasted 40,498 man hours for a net loss to the world’s economy of about $293,613.52. Go us!
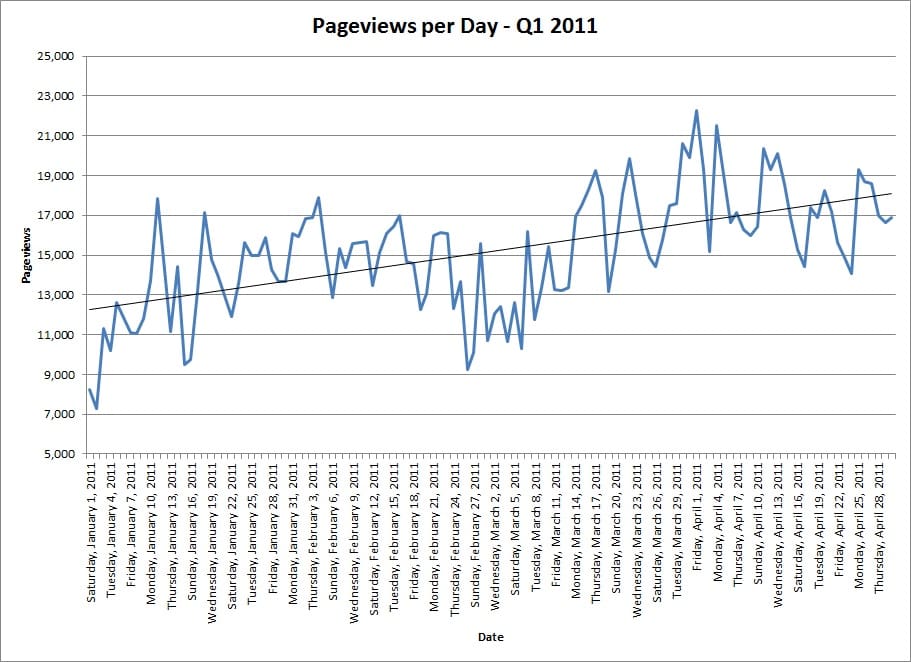
If you look at the pageviews per day (how many times anything on the site was viewed in a given day) we’ve been steadily gaining. We started the year well under 15,000 per day, and ended the quarter with 15,000 per day being a “bad” day. There was a bit in February when apparently everything we did sucked, but we got better. The straight line is a linear trend line to emphasize the awesomeness of the site. For those who are wondering, there is in fact a detectable bump in the traffic from the NRA convention compared to the normal traffic for that day of the week, it just wasn’t “massive.”
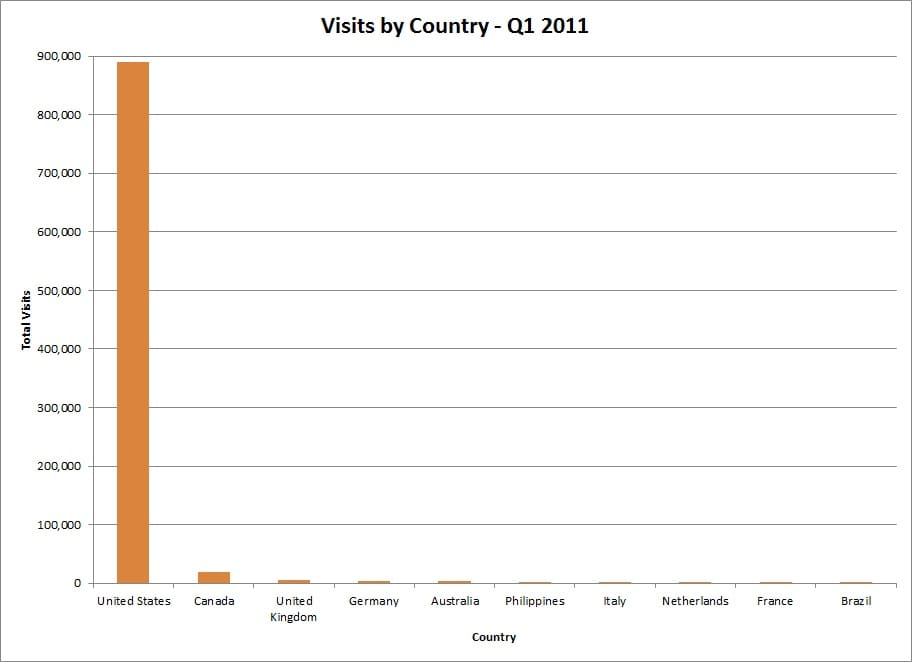
So where do all of these people come from? Surprise surprise, the vast (and I mean VAST) majority are from the United States. Canada is a very predictable second, but then there are a couple legitimate surprises. Great Britain (the land where you need to be 18 to buy dinnerware) is a close third, followed by Germany and Australia, all places with rather restrictive gun laws. Personally, I am more than happy to allow those who do not know the warm embrace of freedom to live vicariously through me (as long as it means RF will keep sending me stuff).
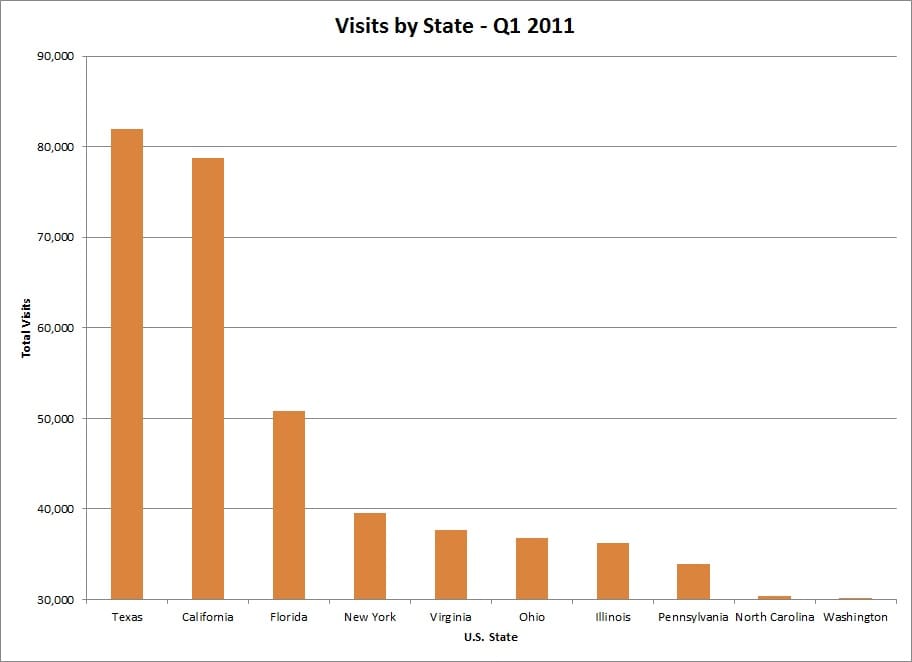
We know that the U.S. produces the most traffic, but which states in particular? As with everything else in that state, Texas’ contribution is massive. Surprisingly, California is the state with the second highest readership despite it being one of the most restrictive states in the Union in terms of firearms laws. Florida is a distant third, followed by New York and then my Virginia. Seeing so many states with restrictive gun laws in the top 10 would seem to indicate that politics related stories would be of great interest, but these are also states with higher populations than the average U.S. state so it might just be random luck that most of our readers are there.
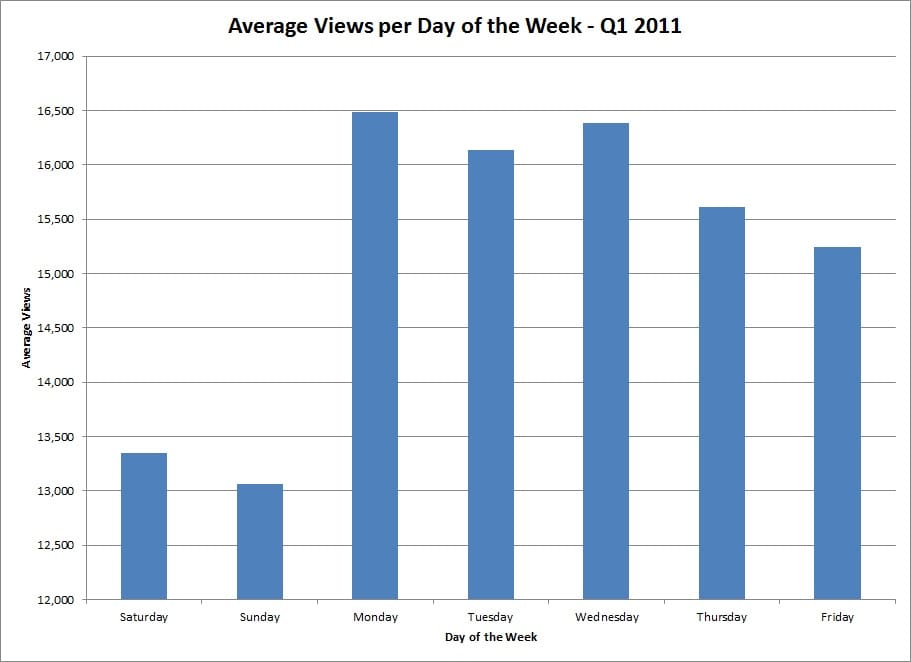
It’s nice to see that we’re getting a lot of views, but WHEN are people viewing the site? Monday is the busiest day of the week in terms of traffic, and weekdays are generally busier than weekends. This would seem to indicate that people view our site when they’re at work, possibly trying to put off that TPS report for a few more minutes and procrastinate their way through the day. Then again, our content might just be better during the week. Despite their seemingly small numbers, 1/4 of our traffic is generated over the weekend. If you’ve ever looked at the hour by hour breakdown (which for some reason is only saved for the last 48 hours) you can almost track the lunch hour as it moves across the United States. There’s a gigantic jump in traffic around 10 AM, and it trails off as the workday ends.
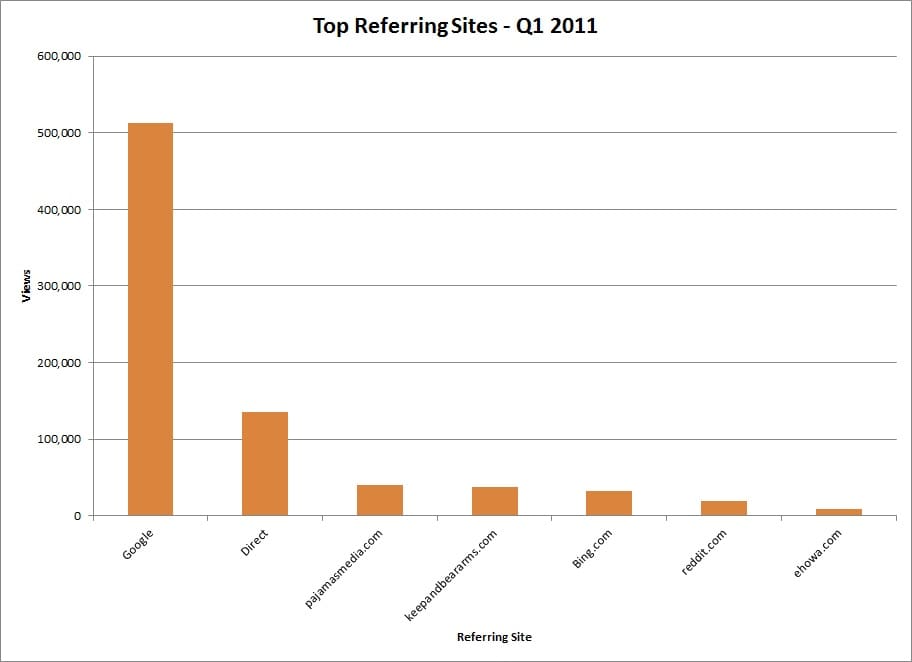 How do people find out about our site? Seems like most people make it here from a search engine of some sort. We publish something that’s awesome, Google picks it up and lets the masses know. So what’s so awesome that it’s pulling hundreds of thousands of people here?
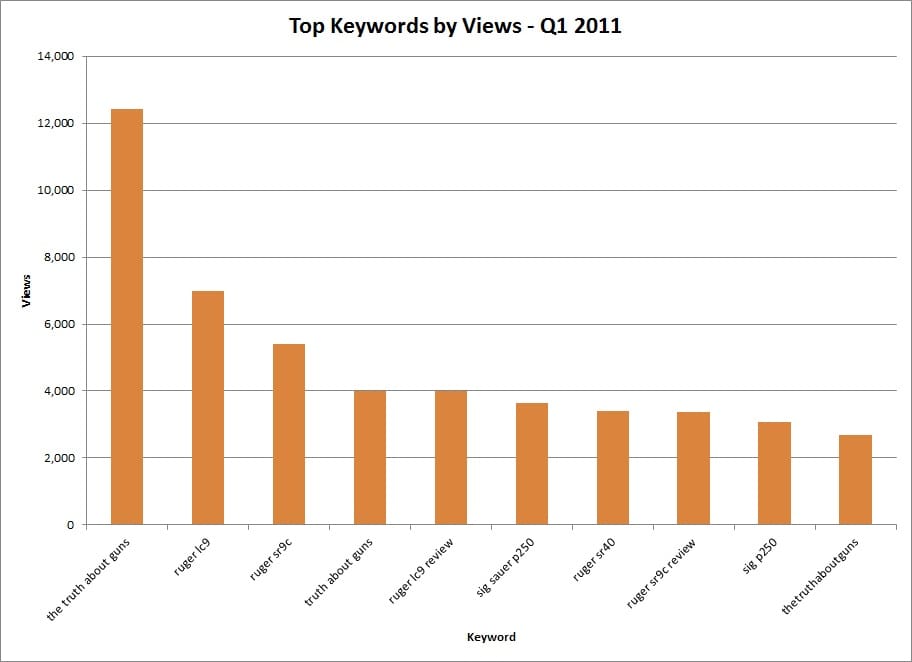 Huh. I guess we just picked a really good name (or people can’t remember our web address). Removing the searches for the name of the site all of the rest of the top keywords are people searching for guns or gun reviews.
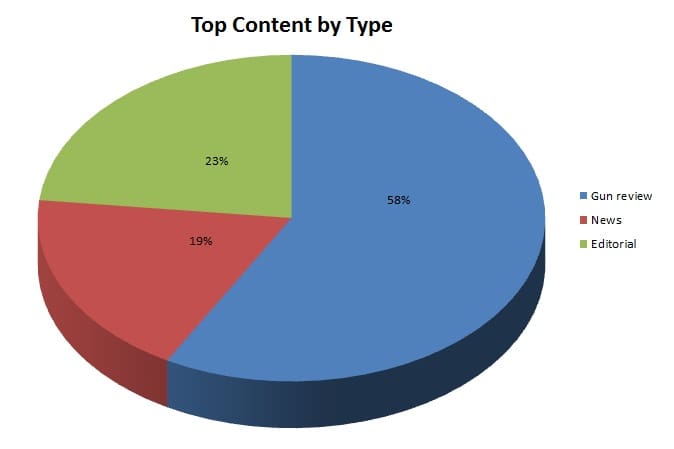 Looking at the top content, of the 50 top articles by pageviews 58% are some sort of gun review, 23% are an editorial, and 19% are news items. People seem to like our gun reviews, especially the Ruger LC9 review. The Ruger LC9 review is the most viewed article of the quarter, pulling in 1/3 more views than anything else (besides the main page).
Let’s put all of this data together. According to the statistics, our average reader is someone living in the southwest United States who is searching for reviews of a concealed carry gun at work during their lunch hour.
Interesting stuff this statistics.
(Lead image stolen from this website)



You forgot to correlate the well above-average IQs of the TTAG Armed Intelligencia against the general population. Or to express it in an equation: Informed Populace = Smarter Populace. Ergo, reading TTAG makes you smarter. Heh.
LOL! And beer makes you smarter by killing off the slowest and weakest brain cells…
You should thank me. I personally viewed 271,876 pages last week by my damn self. While I was traveling. Without internet access. Pretty good, huh?
Is the RSS feed here set to a limit of 10 on purpose, or is there something wrong with both kinds of RSS software I’ve tried for it? When I open up my RSS reader, I get a max of 10 articles.
Any way to get an email notification of a reply to a (my, a reader’s) comment? WordPress apparently can do that, but it needs a hacked script used or something.
Cool stuff. But I notice that some of the charts don’t start at zero on the y (vertical) axis. Not a big deal but this kind of skews the proportions if you’re not viewing them carefully. For instance, Virginia’s viewership is closer to 1/2 of Texas’ rather than the 1/5 it looks like at first glance. And Sunday’s viewership is roughly 79% of Monday’s rather than < 1/4. Not trying to be picky….. okay I'm trying to be picky.
You’re absolutely right, I made the graphs a little more “interesting.” The scales are all proper and the numbers are right, but the impression is what matters. There’s a book called “How to Lie with Statistics” that I highly recommend reading.
Also, the sharp tacks will notice that our “quarter” is actually all of the traditional first quarter plus an extra month. Personally, I like my quarters with four months in them. If Car Talk can have three halves then I can have a four month quarter.
Yes, great book. It’s particularly noteworthy how often the anti-rights crowd uses those very tactics to sway the opinions of the sheeple.
i want to see the stats by author for a friendly little competition
As someone who until recently stared at Google Analytics reports for a living, the Texas/California/New York/Florida stat isn’t that surprising. The sheer volume of people who live in those states is going to skew results in their direction, no matter the topic.
And yes, you did pick a helluva domain name.
Illinois has more site visitors than Pennsylvania?? That honks me off. No offense towards you Illinois guys and gals, I’m pissed at my homeys. Very disappointing that my state scored so low in this respect.
I have tried numerous times to promote this site on various other firearm forums, especially PAFOA. Looks like I gotta step it up a notch.
Your efforts are most appreciated. As are your comments. And I’m only saying that because it’s true.
How about visits per capita by state?
Did anyone notice that 5 of the top 10 searches were for Rugers? How does that compare with the number of gun review articles about Rugers?
The distribution between states is easy to explain. What I can’t understand is why y’all haven’t move the TTAG headquarters to Texas yet. We’ve got beautiful women (tough as nails too), warm weather (perhaps a bit too warm in the summer) and the best jobs market in the US. After the 2012 election cycle the oil business (correctly pronounced “awl bidness”) will be booming again and the state’s coffers will be flush again.
So just what are y’all waiting for. The first beer is on me!
Jeff
+1
Funny thing, Its monday, and im in Florida.
It appears that I’m a minority when it comes to location viewing. I’m a North Carolinian in Brazil…
Comments are closed.